reported ban instances
PUBLISHED-SUMMARY ANALYSIS / JULY 2021–JUNE 2025
Where book bans
are concentrated.
A geographic view of reported school book restrictions, their scale over time, and the questions the evidence leaves open.
Based on the revised research project. Website revision: October 4, 2026. The study window ends in June 2025.
instances since July 2021
of the 2024–2025 total
change from the prior peak
Counts: PEN America, 2025 report ↗. Percentages recalculated from the published totals.
01 / GEOGRAPHY
Three states account for 5,707 instances.
Florida, Texas and Tennessee hold most of the reported total. This map displays the individual state values available in the project’s summary extract.
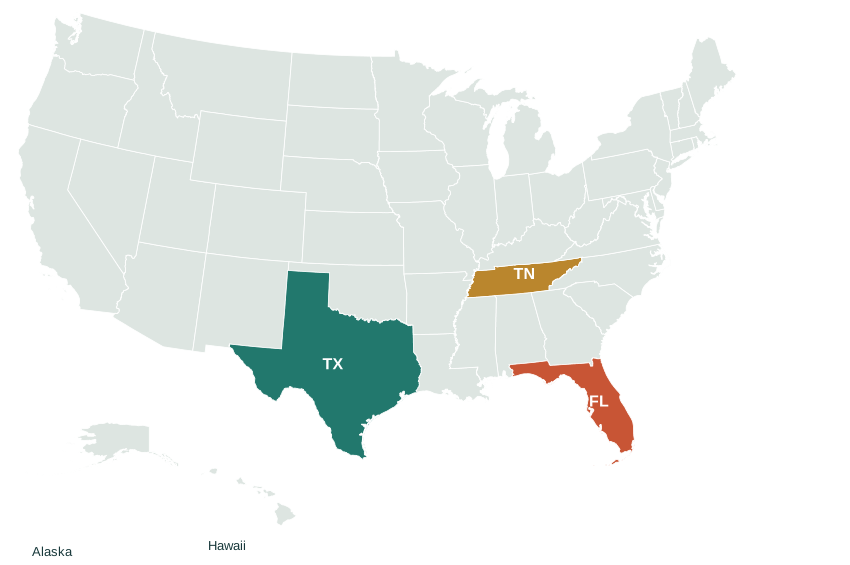
Alaska and Hawaii shown as insets. Map uses the boundaries retained in the QGIS project.
↳
What the map cannot establish. These are counts, not enrollment-adjusted rates. Geographic concentration alone does not explain why bans occurred.
Open the geographic data table
| Geography or system | Instances | Share | Coverage |
|---|---|---|---|
| Florida | 2,304 | 33.5% | Individual state |
| Texas | 1,781 | 25.9% | Individual state |
| Tennessee | 1,622 | 23.6% | Individual state |
| DoDEA | 590 | 8.6% | School system |
| Other reported states | 573 | 8.3% | Combined remainder |
02 / OVER TIME
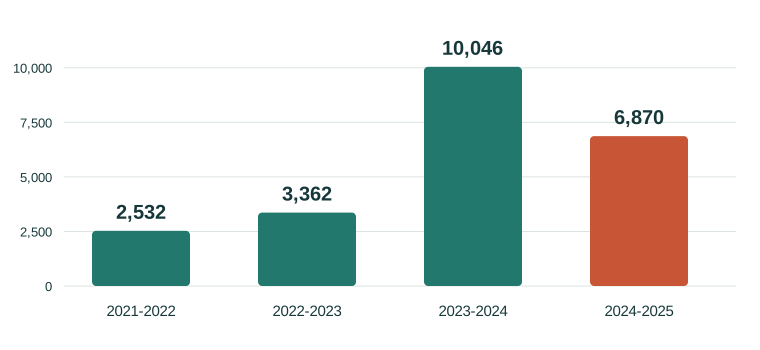
A decline from the peak.
A higher level than 2021–2022.
The latest school-year count fell by 3,176 instances. It was still 171.3% above the first year in this series.
Annual activity, not a remaining balance.
These totals do not tell us how many previously restricted books were later returned.
Open annual totals and changes
| School year | Instances | Year-over-year |
|---|---|---|
| 2021–2022 | 2,532 | Baseline |
| 2022–2023 | 3,362 | +32.8% |
| 2023–2024 | 10,046 | +198.8% |
| 2024–2025 | 6,870 | −31.6% |
NEW / RECONSTRUCTED STATE COMPARISON
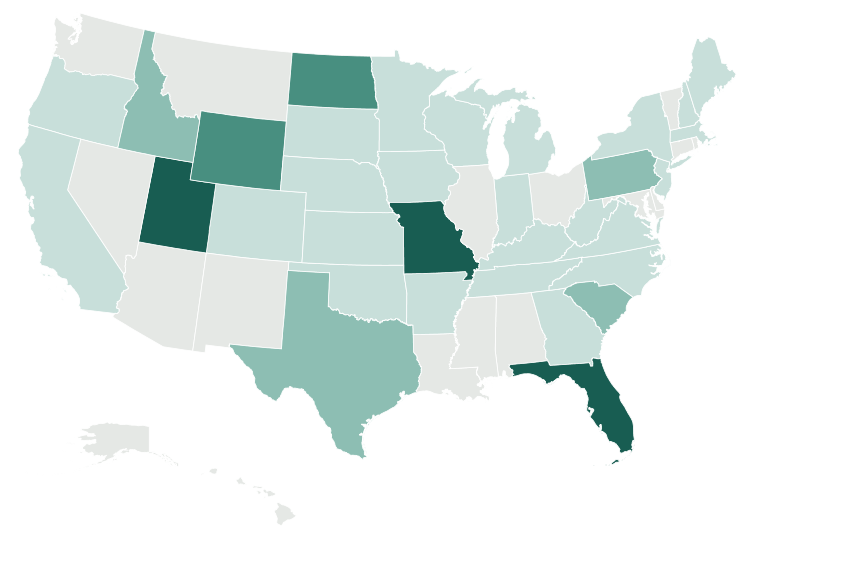
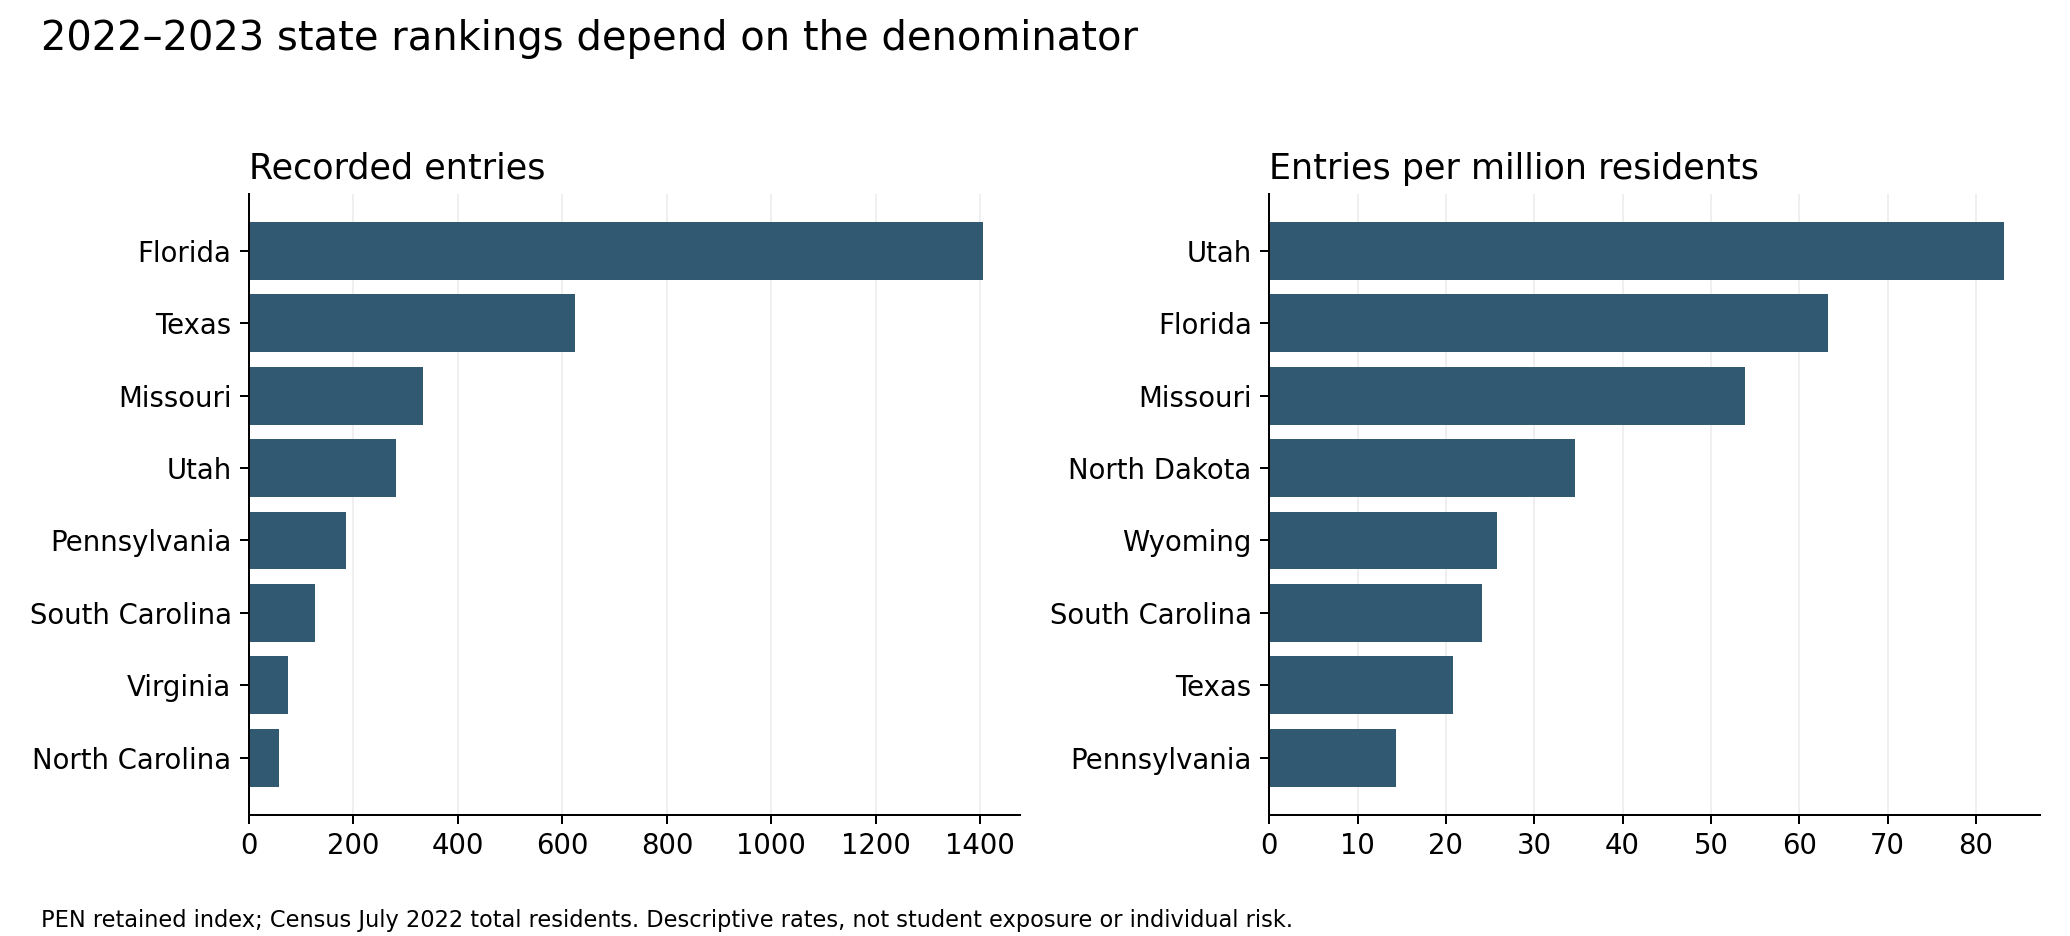
Population changes the ranking.
2022–2023The retained PEN workbook contains 3,362 entries across 33 states. Joining it to Census population data produces a different ranking: Florida leads by count; Utah leads per million residents.
Counting rule clarified: one Texas entry has a blank title. Retaining it gives 3,362 entries nationally and 625 in Texas; counting only entries with titles gives 3,361 and 624. The website uses the retained-entry count. The workbook’s two sheets show the same events and are not added together.
Explore all 50 states
50 states shown
| State | Entries | Residents | Per million | Dem./lean Dem. | Rep./lean Rep. | Evangelical Protestant | Largest religious category, ties retained | Index status |
|---|---|---|---|---|---|---|---|---|
| Alabama | 0 | 5,074,296 | 0.00 | 35% | 50% | 49% | Evangelical | No entries in retained index |
| Alaska | 0 | 733,583 | 0.00 | 31% | 52% | 22% | Unaffiliated | No entries in retained index |
| Arizona | 0 | 7,359,197 | 0.00 | 40% | 42% | 26% | Unaffiliated | No entries in retained index |
| Arkansas | 4 | 3,045,637 | 1.31 | 36% | 45% | 46% | Evangelical | Recorded |
| California | 1 | 39,029,342 | 0.03 | 51% | 30% | 20% | Catholic | Recorded |
| Colorado | 8 | 5,839,926 | 1.37 | 46% | 37% | 26% | Unaffiliated | Recorded |
| Connecticut | 0 | 3,626,205 | 0.00 | 51% | 32% | 13% | Catholic | No entries in retained index |
| Delaware | 0 | 1,018,396 | 0.00 | 45% | 33% | 15% | Unaffiliated | No entries in retained index |
| Florida | 1,406 | 22,244,823 | 63.21 | 42% | 39% | 24% | Evangelical; Unaffiliated | Recorded |
| Georgia | 4 | 10,912,876 | 0.37 | 42% | 40% | 38% | Evangelical | Recorded |
| Hawaii | 0 | 1,440,196 | 0.00 | 50% | 28% | 25% | Unaffiliated | No entries in retained index |
| Idaho | 25 | 1,939,033 | 12.89 | 31% | 53% | 21% | Unaffiliated | Recorded |
| Illinois | 0 | 12,582,032 | 0.00 | 50% | 33% | 20% | Catholic | No entries in retained index |
| Indiana | 3 | 6,833,037 | 0.44 | 41% | 43% | 31% | Evangelical | Recorded |
| Iowa | 6 | 3,200,517 | 1.87 | 42% | 42% | 28% | Mainline | Recorded |
| Kansas | 7 | 2,937,150 | 2.38 | 34% | 48% | 31% | Evangelical | Recorded |
| Kentucky | 3 | 4,512,310 | 0.66 | 41% | 45% | 49% | Evangelical | Recorded |
| Louisiana | 0 | 4,590,241 | 0.00 | 40% | 43% | 27% | Evangelical | No entries in retained index |
| Maine | 13 | 1,385,340 | 9.38 | 47% | 39% | 14% | Unaffiliated | Recorded |
| Maryland | 0 | 6,164,660 | 0.00 | 56% | 28% | 18% | Unaffiliated | No entries in retained index |
| Massachusetts | 1 | 6,981,974 | 0.14 | 57% | 26% | 9% | Catholic | Recorded |
| Michigan | 39 | 10,034,113 | 3.89 | 45% | 38% | 25% | Evangelical | Recorded |
| Minnesota | 1 | 5,717,184 | 0.17 | 47% | 37% | 19% | Mainline | Recorded |
| Mississippi | 0 | 2,940,057 | 0.00 | 38% | 45% | 41% | Evangelical | No entries in retained index |
| Missouri | 333 | 6,177,957 | 53.90 | 38% | 45% | 36% | Evangelical | Recorded |
| Montana | 0 | 1,122,867 | 0.00 | 37% | 51% | 28% | Unaffiliated | No entries in retained index |
| Nebraska | 6 | 1,967,923 | 3.05 | 35% | 50% | 25% | Evangelical | Recorded |
| Nevada | 0 | 3,177,772 | 0.00 | 42% | 39% | 20% | Unaffiliated | No entries in retained index |
| New Hampshire | 1 | 1,395,231 | 0.72 | 43% | 40% | 13% | Unaffiliated | Recorded |
| New Jersey | 3 | 9,261,699 | 0.32 | 48% | 33% | 13% | Catholic | Recorded |
| New Mexico | 0 | 2,113,344 | 0.00 | 48% | 34% | 23% | Catholic | No entries in retained index |
| New York | 6 | 19,677,151 | 0.30 | 52% | 29% | 10% | Catholic | Recorded |
| North Carolina | 58 | 10,698,973 | 5.42 | 44% | 39% | 35% | Evangelical | Recorded |
| North Dakota | 27 | 779,261 | 34.65 | 28% | 56% | 22% | Mainline | Recorded |
| Ohio | 0 | 11,756,058 | 0.00 | 41% | 42% | 29% | Evangelical | No entries in retained index |
| Oklahoma | 2 | 4,019,800 | 0.50 | 35% | 49% | 47% | Evangelical | Recorded |
| Oregon | 38 | 4,240,137 | 8.96 | 49% | 36% | 29% | Unaffiliated | Recorded |
| Pennsylvania | 186 | 12,972,008 | 14.34 | 46% | 41% | 19% | Catholic | Recorded |
| Rhode Island | 0 | 1,093,734 | 0.00 | 48% | 27% | 14% | Catholic | No entries in retained index |
| South Carolina | 127 | 5,282,634 | 24.04 | 37% | 47% | 35% | Evangelical | Recorded |
| South Dakota | 2 | 909,824 | 2.20 | 35% | 52% | 25% | Mainline | Recorded |
| Tennessee | 11 | 7,051,339 | 1.56 | 35% | 47% | 52% | Evangelical | Recorded |
| Texas | 625 | 30,029,572 | 20.81 | 38% | 41% | 31% | Evangelical | Recorded |
| Utah | 281 | 3,380,800 | 83.12 | 29% | 56% | 7% | Mormon | Recorded |
| Vermont | 0 | 647,064 | 0.00 | 52% | 30% | 11% | Unaffiliated | No entries in retained index |
| Virginia | 75 | 8,683,619 | 8.64 | 45% | 38% | 30% | Evangelical | Recorded |
| Washington | 0 | 7,785,786 | 0.00 | 49% | 34% | 25% | Unaffiliated | No entries in retained index |
| West Virginia | 2 | 1,775,156 | 1.13 | 40% | 44% | 39% | Evangelical | Recorded |
| Wisconsin | 43 | 5,892,539 | 7.30 | 43% | 41% | 22% | Catholic; Unaffiliated | Recorded |
| Wyoming | 15 | 581,381 | 25.80 | 27% | 56% | 27% | Evangelical | Recorded |
50-state data (CSV) ↓ · Correlations and sensitivity results (CSV) ↓ · Retained PEN workbook (XLSX) ↓
Political and religious associations depend on the measure
| State characteristic | Outcome | Pearson r | Spearman ρ |
|---|---|---|---|
| Republican minus Democratic share (2017) | Recorded entries | 0.072 | 0.295 |
| Republican minus Democratic share (2017) | Entries per million residents | 0.389 | 0.417 |
| Evangelical Protestant share (2014) | Recorded entries | -0.011 | 0.179 |
| Evangelical Protestant share (2014) | Entries per million residents | -0.118 | 0.156 |
The evangelical-share correlation is close to zero for raw counts and negative for population rates using Pearson’s measure; rank correlations are positive. These results do not establish religion as a cause or a reliable predictor of bans. The download also reports results for the 33 states with entries and after excluding Florida and Texas.
Different source years. Gallup’s 2017 political shares and Pew’s 2014 religious shares predate the ban records. No causal model or new forecast was fitted, and survey uncertainty is not incorporated in these descriptive correlations. State averages do not identify individual challengers.
Sources: Census 2022 population CSV · Gallup 2017 state table · Pew 2014 survey, printed pages 143–146 · Acquisition records · Reconstruction source checksums.
03 / INSTITUTIONS & COMMUNITY RESPONSE
Public objections were documented.
That is 80.5% of affected districts. Opposition was common; its presence does not establish that a restriction was reversed.
RESEARCH QUESTION 3What happened when a district reviewed a challenged book with input from librarians and local residents?
Policy pressure had several forms.
Within this policy-pressure subset, PEN attributed 3% to direct removal requirements and 97% to anticipated noncompliance.
The next analysis needs dates for enactment, guidance, enforcement threats and injunctions. A single “law exists” indicator would miss those distinctions.
The title-level subset has a different scope from the headline total.
04 / EARLIER STUDY & DATA AVAILABILITY
What the earlier project measured.
The original report combined 2021–2022 PEN records with state-level population, political affiliation, religious affiliation and Moms for Liberty chapter counts. These describe states and organizations; they do not identify the characteristics of individual people who challenged books.
| Variable or profile | Evidence in the report | Availability for this website |
|---|---|---|
| Population | State-level Census 2022 estimates | Census 2022 total-resident file recovered; 50-state rates completed |
| Political affiliation | State party-affiliation labels; prose cites Gallup 2017 | Gallup 2017 percentages reconstructed for all 50 states; appendix label provenance remains unresolved |
| Religious affiliation | State-level religious-preference table and figures | Pew 2014 percentages recovered for all 50 states; rounded-category ties preserved |
| Organizational activity | Moms for Liberty chapter counts used in the original model | Code and printed outputs in the report; original model-input CSV needed |
| Sexuality and gender | Mentioned in a research question | Awaiting survey data, questionnaire and codebook; no respondent results found in this report |
| Age range | No survey results located in the supplied report | Awaiting the original survey source |
The Ohio forecast in the original output
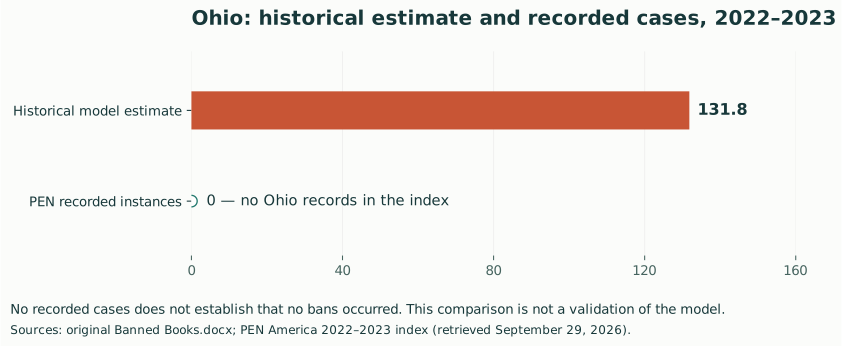
The printed model output gives Ohio 131.830787 predicted bans (about 132) for 2022–2023. This was a linear regression using Moms for Liberty chapter counts, not a forecast fitted for the updated website.
The written conclusion instead names Idaho, although its printed prediction is negative. That inconsistency remains unresolved. Neither result establishes which state would be the next to experience a major increase.
The supplied report does not demonstrate out-of-sample validation. Negative predictions are preserved in the historical CSV for audit purposes, not treated as plausible counts.
Download the transcribed historical output ↓Respondent profiles are not yet available
The survey dataset and questionnaire are needed to establish whose sexuality, gender, age range, religion and political affiliation were measured, how the questions were asked and which responses are missing.
No individual characteristics have been inferred from state-level figures. Any later website profile will use verified aggregate survey results and an appropriate disclosure review.
Record-count difference: the earlier report describes 2,535 PEN rows; the published annual series on this site uses 2,532 instances. These counts have different provenance and have not been reconciled.
Read the earlier report (DOCX) ↓Source: supplied Banned Books.docx, methods, Appendix (Third Layer), printed model output and conclusion. Reviewed September 29, 2026. The original report is preserved as supplied; its interpretations are not adopted as validated findings.
04A / HISTORICAL FORECAST REVIEW
Ohio and the full 50-state forecast.
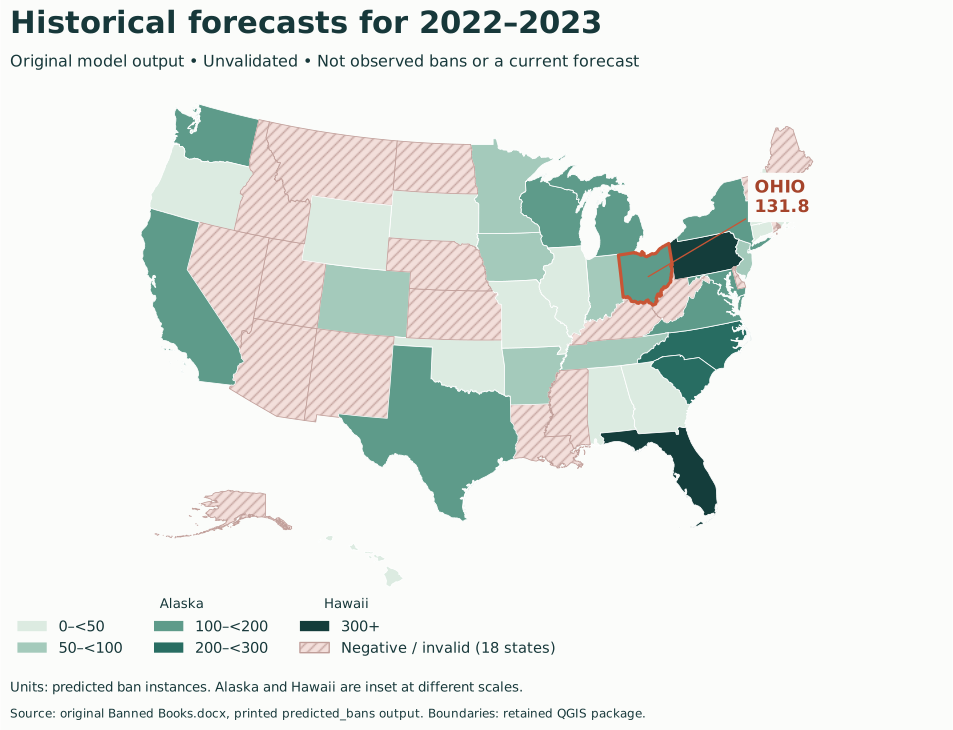
These figures reproduce the earlier model’s predictions for 2022–2023. They are historical, unvalidated estimates. The observed comparison counts entries in PEN’s index for that same school year.
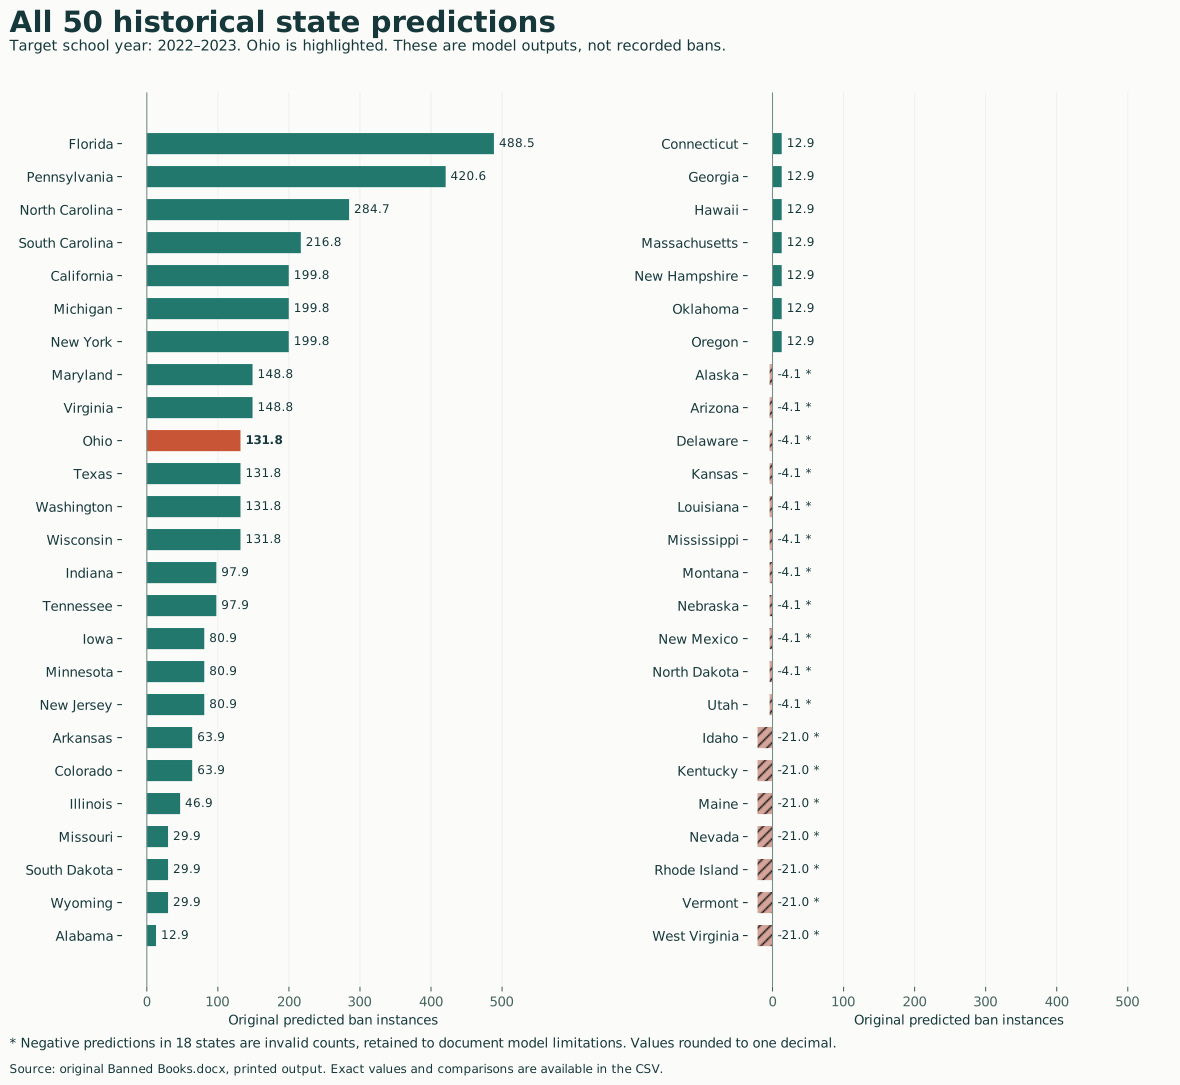
18 of the 50 predictions are negative.
Negative outputs are invalid as ban counts. They are hatched on the map and marked in the chart and table, rather than changed to zero. This is a review of the old model, not a new forecast.
Ohio · 2022–2023
Historical prediction131.8Unvalidated model estimate
PEN index entries0No records in the index; not proof of no bans
PEN reporting is incomplete. The two measures are not interchangeable. Zero index entries means no cases were recorded for that state in this file.
View the all-state prediction chart
View all 50 predictions and recorded counts
| State | Historical prediction | PEN entries | Interpretation |
|---|---|---|---|
| Alabama | 12.9 | 0 | Unvalidated historical estimate. No index records; not proof of no bans. |
| Alaska | -4.1 | 0 | Negative prediction: invalid count. No index records; not proof of no bans. |
| Arizona | -4.1 | 0 | Negative prediction: invalid count. No index records; not proof of no bans. |
| Arkansas | 63.9 | 4 | Unvalidated historical estimate. Recorded instances, not unique titles. |
| California | 199.8 | 1 | Unvalidated historical estimate. Recorded instances, not unique titles. |
| Colorado | 63.9 | 8 | Unvalidated historical estimate. Recorded instances, not unique titles. |
| Connecticut | 12.9 | 0 | Unvalidated historical estimate. No index records; not proof of no bans. |
| Delaware | -4.1 | 0 | Negative prediction: invalid count. No index records; not proof of no bans. |
| Florida | 488.5 | 1,406 | Unvalidated historical estimate. Recorded instances, not unique titles. |
| Georgia | 12.9 | 4 | Unvalidated historical estimate. Recorded instances, not unique titles. |
| Hawaii | 12.9 | 0 | Unvalidated historical estimate. No index records; not proof of no bans. |
| Idaho | -21.0 | 25 | Negative prediction: invalid count. Recorded instances, not unique titles. |
| Illinois | 46.9 | 0 | Unvalidated historical estimate. No index records; not proof of no bans. |
| Indiana | 97.9 | 3 | Unvalidated historical estimate. Recorded instances, not unique titles. |
| Iowa | 80.9 | 6 | Unvalidated historical estimate. Recorded instances, not unique titles. |
| Kansas | -4.1 | 7 | Negative prediction: invalid count. Recorded instances, not unique titles. |
| Kentucky | -21.0 | 3 | Negative prediction: invalid count. Recorded instances, not unique titles. |
| Louisiana | -4.1 | 0 | Negative prediction: invalid count. No index records; not proof of no bans. |
| Maine | -21.0 | 13 | Negative prediction: invalid count. Recorded instances, not unique titles. |
| Maryland | 148.8 | 0 | Unvalidated historical estimate. No index records; not proof of no bans. |
| Massachusetts | 12.9 | 1 | Unvalidated historical estimate. Recorded instances, not unique titles. |
| Michigan | 199.8 | 39 | Unvalidated historical estimate. Recorded instances, not unique titles. |
| Minnesota | 80.9 | 1 | Unvalidated historical estimate. Recorded instances, not unique titles. |
| Mississippi | -4.1 | 0 | Negative prediction: invalid count. No index records; not proof of no bans. |
| Missouri | 29.9 | 333 | Unvalidated historical estimate. Recorded instances, not unique titles. |
| Montana | -4.1 | 0 | Negative prediction: invalid count. No index records; not proof of no bans. |
| Nebraska | -4.1 | 6 | Negative prediction: invalid count. Recorded instances, not unique titles. |
| Nevada | -21.0 | 0 | Negative prediction: invalid count. No index records; not proof of no bans. |
| New Hampshire | 12.9 | 1 | Unvalidated historical estimate. Recorded instances, not unique titles. |
| New Jersey | 80.9 | 3 | Unvalidated historical estimate. Recorded instances, not unique titles. |
| New Mexico | -4.1 | 0 | Negative prediction: invalid count. No index records; not proof of no bans. |
| New York | 199.8 | 6 | Unvalidated historical estimate. Recorded instances, not unique titles. |
| North Carolina | 284.7 | 58 | Unvalidated historical estimate. Recorded instances, not unique titles. |
| North Dakota | -4.1 | 27 | Negative prediction: invalid count. Recorded instances, not unique titles. |
| Ohio | 131.8 | 0 | Unvalidated historical estimate. No index records; not proof of no bans. |
| Oklahoma | 12.9 | 2 | Unvalidated historical estimate. Recorded instances, not unique titles. |
| Oregon | 12.9 | 38 | Unvalidated historical estimate. Recorded instances, not unique titles. |
| Pennsylvania | 420.6 | 186 | Unvalidated historical estimate. Recorded instances, not unique titles. |
| Rhode Island | -21.0 | 0 | Negative prediction: invalid count. No index records; not proof of no bans. |
| South Carolina | 216.8 | 127 | Unvalidated historical estimate. Recorded instances, not unique titles. |
| South Dakota | 29.9 | 2 | Unvalidated historical estimate. Recorded instances, not unique titles. |
| Tennessee | 97.9 | 11 | Unvalidated historical estimate. Recorded instances, not unique titles. |
| Texas | 131.8 | 625 | Unvalidated historical estimate. Recorded instances, not unique titles. |
| Utah | -4.1 | 281 | Negative prediction: invalid count. Recorded instances, not unique titles. |
| Vermont | -21.0 | 0 | Negative prediction: invalid count. No index records; not proof of no bans. |
| Virginia | 148.8 | 75 | Unvalidated historical estimate. Recorded instances, not unique titles. |
| Washington | 131.8 | 0 | Unvalidated historical estimate. No index records; not proof of no bans. |
| West Virginia | -21.0 | 2 | Negative prediction: invalid count. Recorded instances, not unique titles. |
| Wisconsin | 131.8 | 43 | Unvalidated historical estimate. Recorded instances, not unique titles. |
| Wyoming | 29.9 | 15 | Unvalidated historical estimate. Recorded instances, not unique titles. |
All-state comparison (CSV) ↓ · Maps, charts & comparison data (ZIP) ↓ · PEN source workbook (XLSX) ↓
Predictions: original report. Recorded entries: PEN’s 2022–2023 index ↗, linked from its 2023 report ↗. Retrieved September 29, 2026. Aggregation method and source checksum.
04B / HISTORICAL AFFILIATIONS
Religious and political categories from the earlier report.
The original five-state chart classified four states as Evangelical Protestant and Pennsylvania as Catholic. Those labels describe state-level affiliation categories in the earlier input table. They do not identify who challenged books.
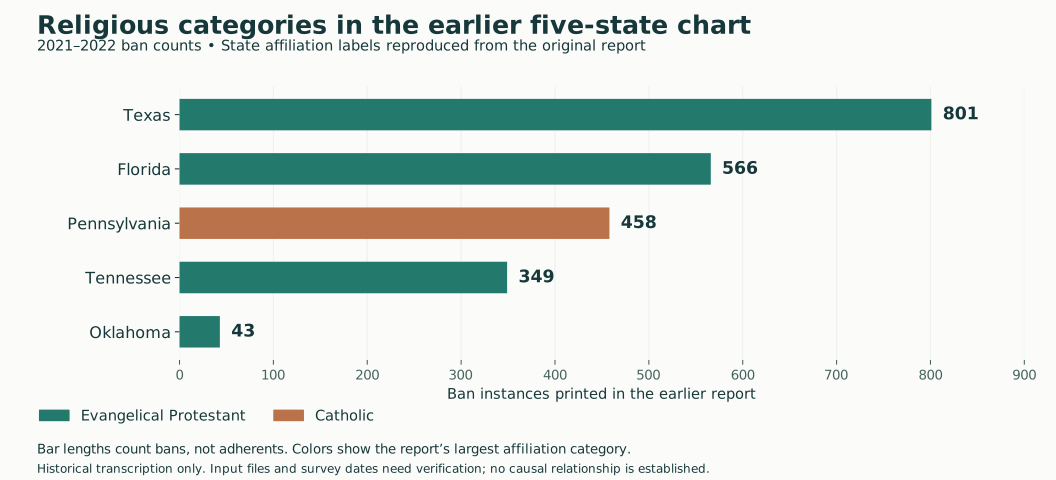
| State | Printed 2021–2022 bans | Religious category | Party label |
|---|---|---|---|
| Texas | 801 | Evangelical Protestant | Democrat |
| Florida | 566 | Evangelical Protestant | Democrat |
| Pennsylvania | 458 | Catholic | Democrat |
| Tennessee | 349 | Evangelical Protestant | Republican |
| Oklahoma | 43 | Evangelical Protestant | Republican |
Recovered-source differences. Gallup 2017 reports Texas at 38% Democrat/lean Democrat and 41% Republican/lean Republican. The original chart’s Democrat label does not match that source. Pew 2014 gives Florida 24% evangelical Protestant and 24% unaffiliated: a tie that the original first-maximum rule conceals. The printed labels in this section are historical transcriptions, not the reconstructed classifications.
How the labels were assigned
The religious code selected the largest affiliation share in each state. Evangelical, Mainline and Historically Black Protestant were separate categories, and the table also included unaffiliated residents. A largest category need not be a majority.
The political code compared Republican/lean Rep. and Democrat/lean Dem. shares. The larger share supplied the label. The report’s prose cites Gallup 2017, but the appendix does not establish the source and survey year of partisan.xlsx. The labels above are preserved as historical output; they are not current political classifications or election results.
Gender, sexual orientation and age still need a source
The supplied report mentions sexuality and gender in a research question, but no respondent results were located. No age-range results were found. The original survey, questionnaire and codebook are needed to establish whether these fields describe respondents, challengers, authors or book content. The website does not substitute community characteristics for personal responses.
Interpretation: four Evangelical Protestant labels in a selected five-state figure do not establish a national association, a cause of bans or a predictive trait. The new 50-state comparison above uses recovered Gallup and Pew percentages, separately from these historical labels.
Historical affiliations (CSV) ↓ · Source and coding notes · Revised full report (DOCX) ↓
Source: supplied Banned Books.docx, appendix code, printed party table and combined five-state chart. Reviewed September 29, 2026.
GDELT / NEWS VALIDATION · JULY 2022–JUNE 2023
News coverage needs a district check.
The preserved annual export contains 15,767 news records and 15,730 distinct URLs. A district-name screen selected 1,054 candidate records. A fixed sample of 36 was reviewed, with three records from each month.
school-book topic supported
public-library or unrelated activity
insufficient article evidence
records support an original candidate
Relevant news is not a verified ban event.
The original 32 title checks produced 12 title–district correspondences. The October 3 follow-up adds the Bible–Davis match and verifies a June 20, 2023 board vote to reinstate it. The removal and actual reshelving dates remain unresolved; no restriction duration is calculated. The October 4 workbook audit corrected three month descriptions in the report. Indian River is March, Miami-Dade is March, and Davis is May 2023. The underlying CSV dates were already correct. The Indian River month conflict is withdrawn; exact onset and remaining date/stage questions still need evidence. These sample counts are not an estimate of national accuracy or the number of bans.
Names can mislead: a Knox County story concerns a Maine school district, and an NBC San Diego report concerns Indian River County, Florida. Other keyword matches describe late-fine removal or a library play activity.
RQ3: What happened when a district reviewed a challenged book with input from librarians and local residents?
The Davis minutes document public comments and a unanimous reinstatement vote. They do not establish that opposition caused the decision. Reports distinguish proposals, reviews, retained books and removals. The next analysis needs verified access histories before comparing restriction duration or reversal.
Read all 36 decisions and methods → · Review table (CSV) ↓ · Code, data and audit (ZIP) ↓
Read the date corrections · Open the independent-review form
Review version 13: October 4, 2026. All 3,362 extracted PEN rows were checked against workbook cells. Independent human review remains pending. One of the 20 previously unresolved original articles was recovered; 19 remain unresolved. The earlier 62,258-record pilot is a separate collection and is not added to this annual extract. No additional BigQuery job was run for this validation.
05 / METHODS & STATUS
What is complete. What still needs data.
Published-summary analysis
- Annual changes and geographic shares recalculated.
- Geographic categories reconcile to 6,870.
- Charts, map and source checksums generated by code.
- Core counting audit: 16 tests passed.
- Population, political and religion sources joined for all 50 states.
- Resident rates, correlations and sensitivity tables reproduced offline.
District-level explanation
- Official 2024–2025 event records and a verified NCES district frame.
- Enrollment, policy dates and dated organizational activity.
- Coverage information needed to distinguish zero from missing.
- Model fitting, resistance outcomes and temporal comparisons.
Read the checks before analysis
- Each district name will be checked against the NCES directory and assigned one NCES identification number. If the match is uncertain, the record will remain unresolved until it can be checked manually.
- Every restriction will be assigned to a school year. A month will be recorded only when the source provides enough detail; otherwise, the record will show that the date is approximate.
- Exact and possible duplicate records will be listed before any records are combined. Restrictions ordered at the state level will not be merged with actions taken by individual districts.
- The yearly, state and district totals will be recalculated and compared with PEN America’s published figures. Differences will be investigated and recorded.
- Missing information and unavailable sources will be reported for each state and school year.
- A forecasting model will use only information that existed before the period being predicted.
Interpretation limits. Reporting is incomplete. Aggregate patterns do not identify an individual’s beliefs or motives. This website reports descriptive findings; no new causal model or forecast has been fitted. Social-media collection remains outside this phase.
06 / FILES & REPRODUCIBILITY
Take the evidence with you.
Review the numbers, rerun the calculations,
or inspect the historical QGIS project.
ZIP / GDELT VALIDATION
News validation, code & data ↓
October 4 date audit and independent-review form: preserved annual export, district review, 36-record sample, sources and offline reproduction scripts. Article evidence and dated event links are distinguished.
ZIP / PYTHON + CSVRevised report, code & data ↓
October 1 revision: report, 50-state source tables, rates, correlations, charts, counting audit and offline scripts. Missing original survey and 2024–2025 event files are identified.
DOCX / CURRENT REPORTRevised comparison report ↓
October 1, 2026. Reconciled counts, recovered affiliation sources, 50-state comparisons and explicit remaining data needs.
PPTX / PRESENTATIONSlides with QGIS maps ↓
September 3, 2026 presentation, including maps and research limitations.
ZIP / QGIS PROJECTQGIS maps & layers ↓
QGZ and QGS project files, GeoPackage, boundary data, summary tables and map exports. Extract the folder before opening the project.
DOCX / HISTORICAL SOURCEEarlier research report ↓
Original report as supplied, including state demographic figures, code and historical forecasts. Contains unresolved inconsistencies.
ZIP / COMPLETE V2 ARCHIVEFull V2 research package ↓
September 3, 2026 proposal, plan, final report, slides and QGIS files. This archive is distinct from the earlier research report.
Research proposal (DOCX) ↓ · Data and analysis plan (DOCX) ↓ · Summary source register (JSON) ↓ · Download inventory & checksums (JSON) ↓
The state report retains its October 1, 2026 reconstruction and counting corrections. The website also includes the October 4 GDELT date audit, including corrections to three month descriptions. The proposal, plan, slides, QGIS files and full V2 archive retain their September 3 versions. Recovered demographic source tables are included in the revised download. Original survey responses, original chapter-model training data and the 2024–2025 PEN event-level export remain unavailable. The website map uses the QGIS package’s boundary file; QGIS desktop was not rerun for this update.