one title restricted in one district
CURRENT ANALYSIS / SCHOOL YEAR 2025–26
Where school book bans were recorded in 2025–26.
A new state analysis of PEN America’s 2025–26 index: where bans were recorded, at what rate, how that relates to how states voted, and what a state-level model can and cannot tell us.
Website revision: November 9, 2026. This page does not compare school years; the earlier verification work is on the main page.
among those instances
with at least one recorded ban
of all recorded instances
Source: PEN America, “A Spotlight on School Book Bans,” October 5, 2026 ↗. PEN reports “nearly 12,000”; 11,982 is the exact figure on the same page.
01 / GEOGRAPHY
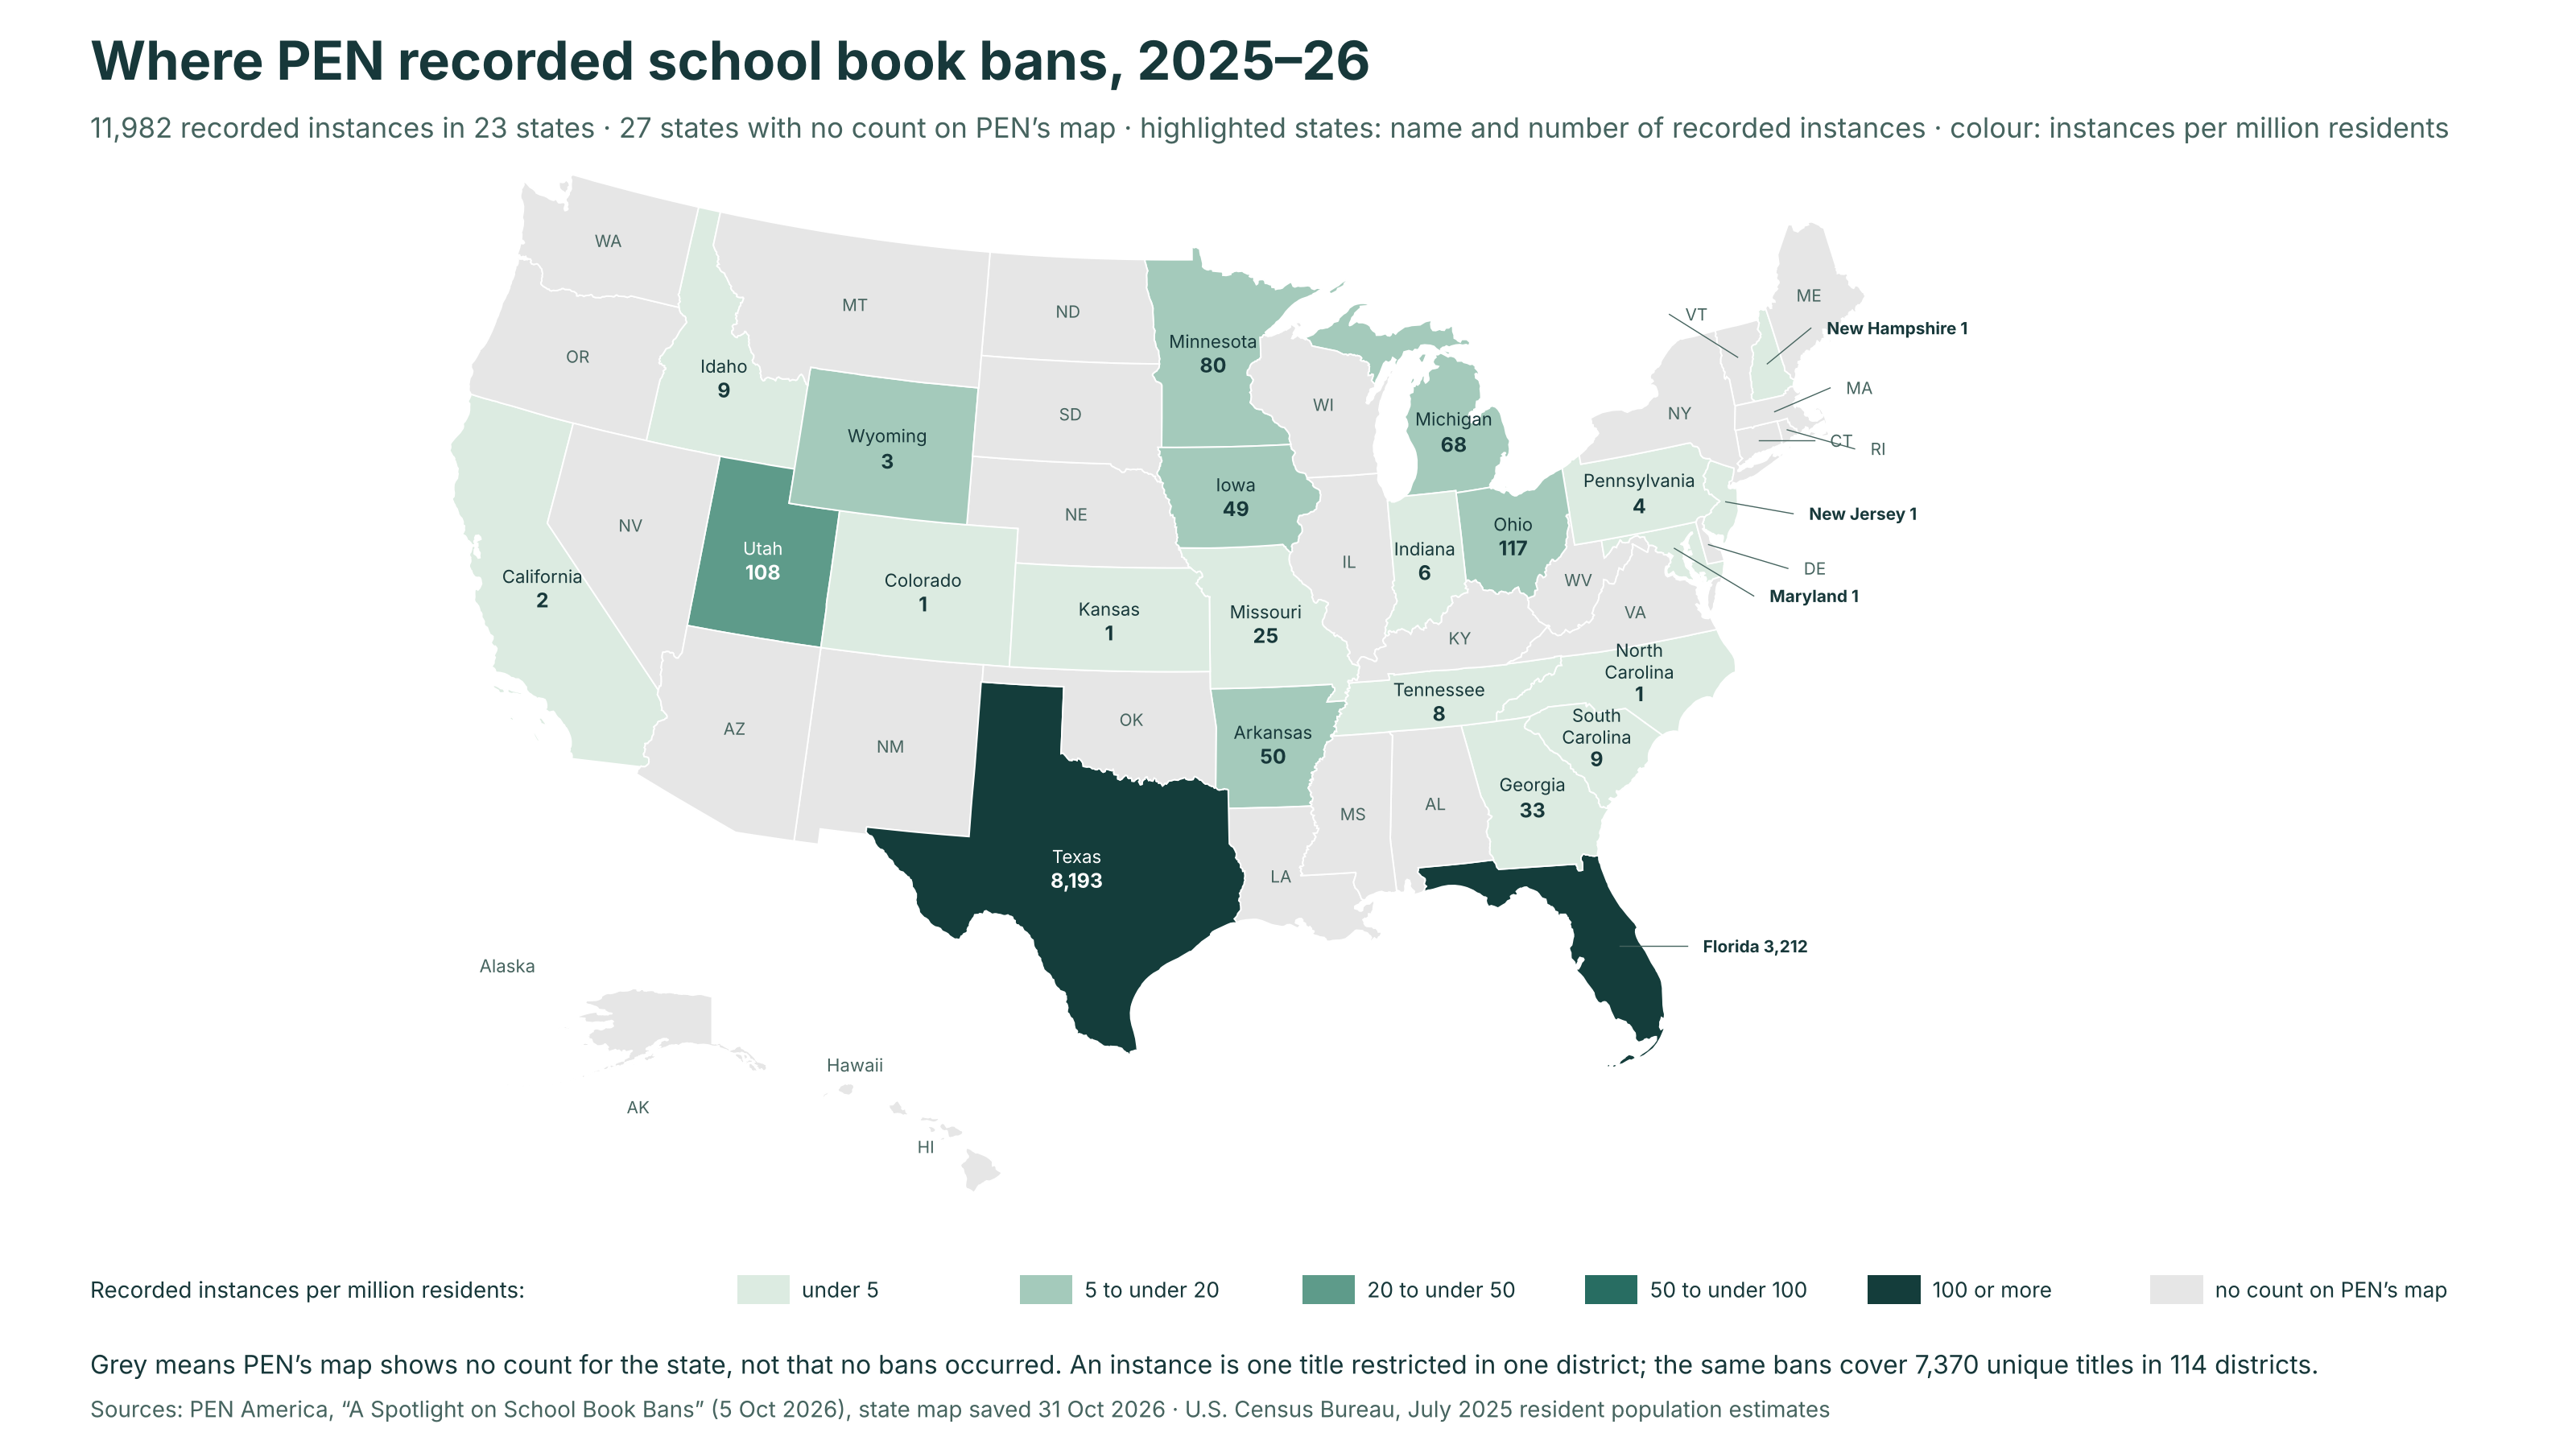
11,982 recorded instances in 23 states.
States with a recorded count show their name and number of instances. Colour shows instances per million residents. The other 27 states have no count on PEN’s map.
Scroll sideways to read the state labels.
↳
What the map cannot establish. PEN relies on public reports and records requests, and coverage is uneven between states. A high count reflects both restrictions and how fully they were reported.
02 / WHAT THE FIGURES COUNT
The published figures agree once the unit is named.
Several numbers circulate for 2025. They count different things over different periods, so they are not expected to match.
| Figure | Source and period | What it counts | Used here |
|---|---|---|---|
| 11,982 (“nearly 12,000”) | PEN America, 2025–26 school year | Instances: one title restricted in one school district | Yes: the map and model total |
| 7,370 | PEN America, 2025–26 | Unique titles among those instances | Context only; not published by state |
| 114 | PEN America, 2025–26 | School districts with at least one instance | Context only; not published by state |
| 34,000 | PEN America, since 2021 | All instances over five school years | No: a cumulative total |
| 4,235 · 713 · 5,668 | American Library Association, calendar year 2025 | Unique titles challenged · censorship attempts · books banned, in public, school and academic libraries, as reported to ALA | No: a different tracker, period and set of libraries |
ALA figures: Office for Intellectual Freedom, released during National Library Week, April 2026 (ala.org ↗). This analysis uses PEN’s state counts consistently throughout.
03 / RATES
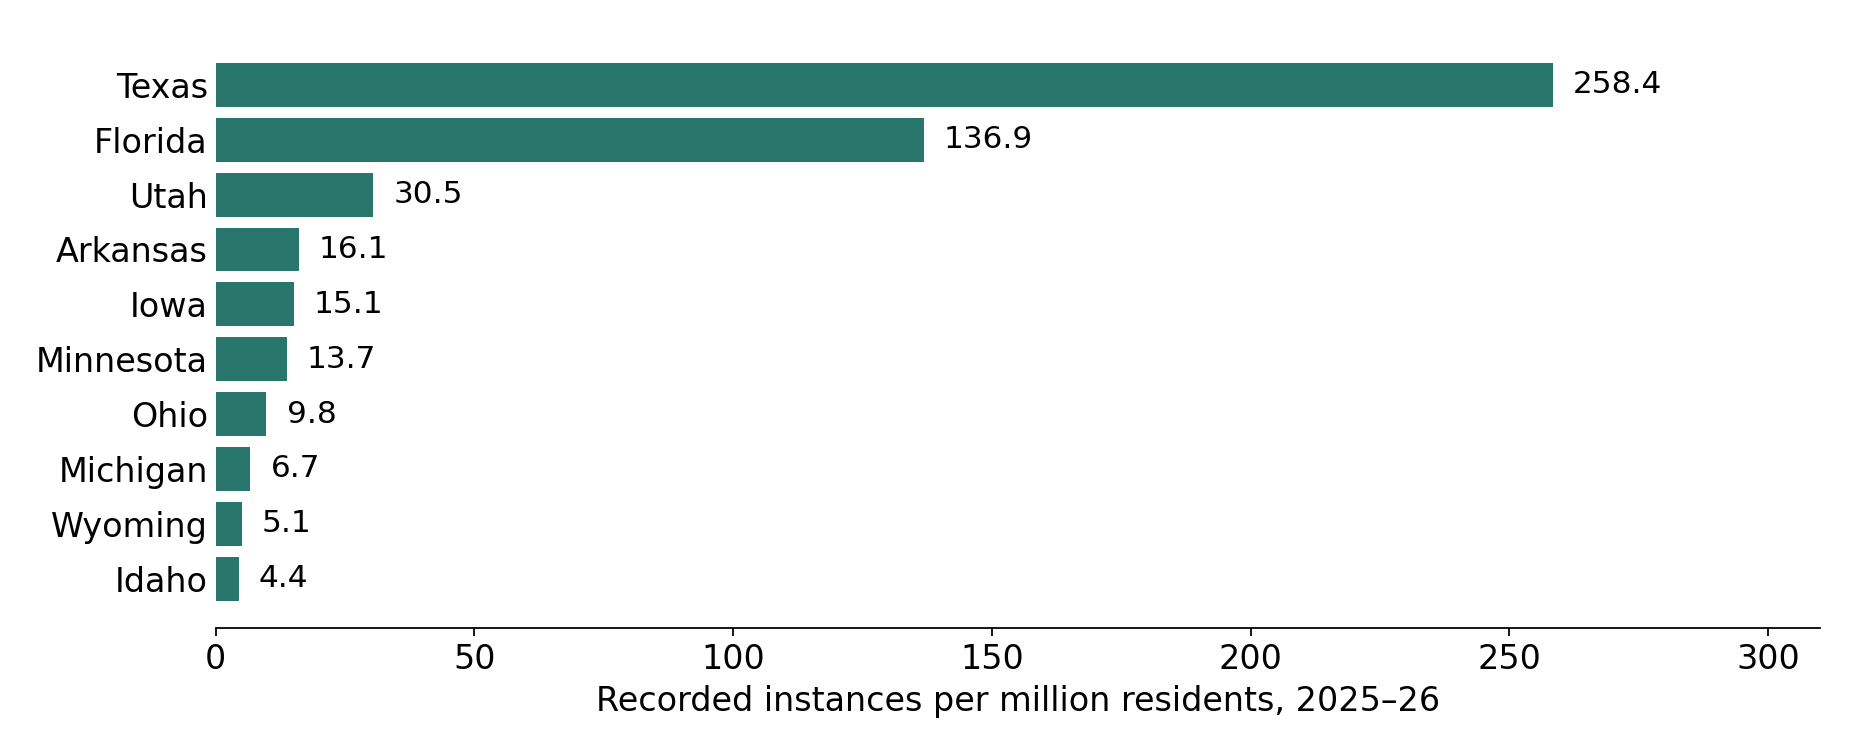
Texas and Florida stand apart on rate as well as count.
Texas recorded 258.4 instances per million residents and Florida 136.9, far above Utah at 30.5. Half the states have no recorded count, so the median state has zero.
Small states move up on few instances.
Wyoming’s 5.1 per million is three instances; Idaho’s 4.4 is nine.
Explore all 50 states
50 states shown
| State | Instances | Residents | Per million | 2024 margin | PEN map status |
|---|---|---|---|---|---|
| Alabama | 0 | 5,193,088 | 0.00 | R +30.5 | No count on PEN’s map |
| Alaska | 0 | 737,270 | 0.00 | R +13.1 | No count on PEN’s map |
| Arizona | 0 | 7,623,818 | 0.00 | R +5.5 | No count on PEN’s map |
| Arkansas | 50 | 3,114,791 | 16.05 | R +30.6 | Count on PEN’s map |
| California | 2 | 39,355,309 | 0.05 | D +20.1 | Count on PEN’s map |
| Colorado | 1 | 6,012,561 | 0.17 | D +11.0 | Count on PEN’s map |
| Connecticut | 0 | 3,688,496 | 0.00 | D +14.5 | No count on PEN’s map |
| Delaware | 0 | 1,059,952 | 0.00 | D +14.7 | No count on PEN’s map |
| Florida | 3,212 | 23,462,518 | 136.90 | R +13.1 | Count on PEN’s map |
| Georgia | 33 | 11,302,748 | 2.92 | R +2.2 | Count on PEN’s map |
| Hawaii | 0 | 1,432,820 | 0.00 | D +23.1 | No count on PEN’s map |
| Idaho | 9 | 2,029,733 | 4.43 | R +36.5 | Count on PEN’s map |
| Illinois | 0 | 12,719,141 | 0.00 | D +10.9 | No count on PEN’s map |
| Indiana | 6 | 6,973,333 | 0.86 | R +19.0 | Count on PEN’s map |
| Iowa | 49 | 3,238,387 | 15.13 | R +13.2 | Count on PEN’s map |
| Kansas | 1 | 2,977,220 | 0.34 | R +16.1 | Count on PEN’s map |
| Kentucky | 0 | 4,606,864 | 0.00 | R +30.5 | No count on PEN’s map |
| Louisiana | 0 | 4,618,189 | 0.00 | R +22.0 | No count on PEN’s map |
| Maine | 0 | 1,414,874 | 0.00 | D +6.9 | No count on PEN’s map |
| Maryland | 1 | 6,265,347 | 0.16 | D +28.5 | Count on PEN’s map |
| Massachusetts | 0 | 7,154,084 | 0.00 | D +25.2 | No count on PEN’s map |
| Michigan | 68 | 10,127,884 | 6.71 | R +1.4 | Count on PEN’s map |
| Minnesota | 80 | 5,830,405 | 13.72 | D +4.2 | Count on PEN’s map |
| Mississippi | 0 | 2,954,160 | 0.00 | R +22.9 | No count on PEN’s map |
| Missouri | 25 | 6,270,541 | 3.99 | R +18.4 | Count on PEN’s map |
| Montana | 0 | 1,144,694 | 0.00 | R +19.9 | No count on PEN’s map |
| Nebraska | 0 | 2,018,006 | 0.00 | R +20.5 | No count on PEN’s map |
| Nevada | 0 | 3,282,188 | 0.00 | R +3.1 | No count on PEN’s map |
| New Hampshire | 1 | 1,415,342 | 0.71 | D +2.8 | Count on PEN’s map |
| New Jersey | 1 | 9,548,215 | 0.10 | D +5.9 | Count on PEN’s map |
| New Mexico | 0 | 2,125,498 | 0.00 | D +6.0 | No count on PEN’s map |
| New York | 0 | 20,002,427 | 0.00 | D +12.6 | No count on PEN’s map |
| North Carolina | 1 | 11,197,968 | 0.09 | R +3.2 | Count on PEN’s map |
| North Dakota | 0 | 799,358 | 0.00 | R +36.4 | No count on PEN’s map |
| Ohio | 117 | 11,900,510 | 9.83 | R +11.2 | Count on PEN’s map |
| Oklahoma | 0 | 4,123,288 | 0.00 | R +34.3 | No count on PEN’s map |
| Oregon | 0 | 4,273,586 | 0.00 | D +14.3 | No count on PEN’s map |
| Pennsylvania | 4 | 13,059,432 | 0.31 | R +1.7 | Count on PEN’s map |
| Rhode Island | 0 | 1,114,521 | 0.00 | D +13.8 | No count on PEN’s map |
| South Carolina | 9 | 5,570,274 | 1.62 | R +17.9 | Count on PEN’s map |
| South Dakota | 0 | 935,094 | 0.00 | R +29.2 | No count on PEN’s map |
| Tennessee | 8 | 7,315,076 | 1.09 | R +29.7 | Count on PEN’s map |
| Texas | 8,193 | 31,709,821 | 258.37 | R +13.7 | Count on PEN’s map |
| Utah | 108 | 3,538,904 | 30.52 | R +21.6 | Count on PEN’s map |
| Vermont | 0 | 644,663 | 0.00 | D +31.5 | No count on PEN’s map |
| Virginia | 0 | 8,880,107 | 0.00 | D +5.8 | No count on PEN’s map |
| Washington | 0 | 8,001,020 | 0.00 | D +18.2 | No count on PEN’s map |
| West Virginia | 0 | 1,766,147 | 0.00 | R +41.9 | No count on PEN’s map |
| Wisconsin | 0 | 5,972,787 | 0.00 | R +0.9 | No count on PEN’s map |
| Wyoming | 3 | 588,753 | 5.10 | R +45.8 | Count on PEN’s map |
04 / THE 2024 VOTE
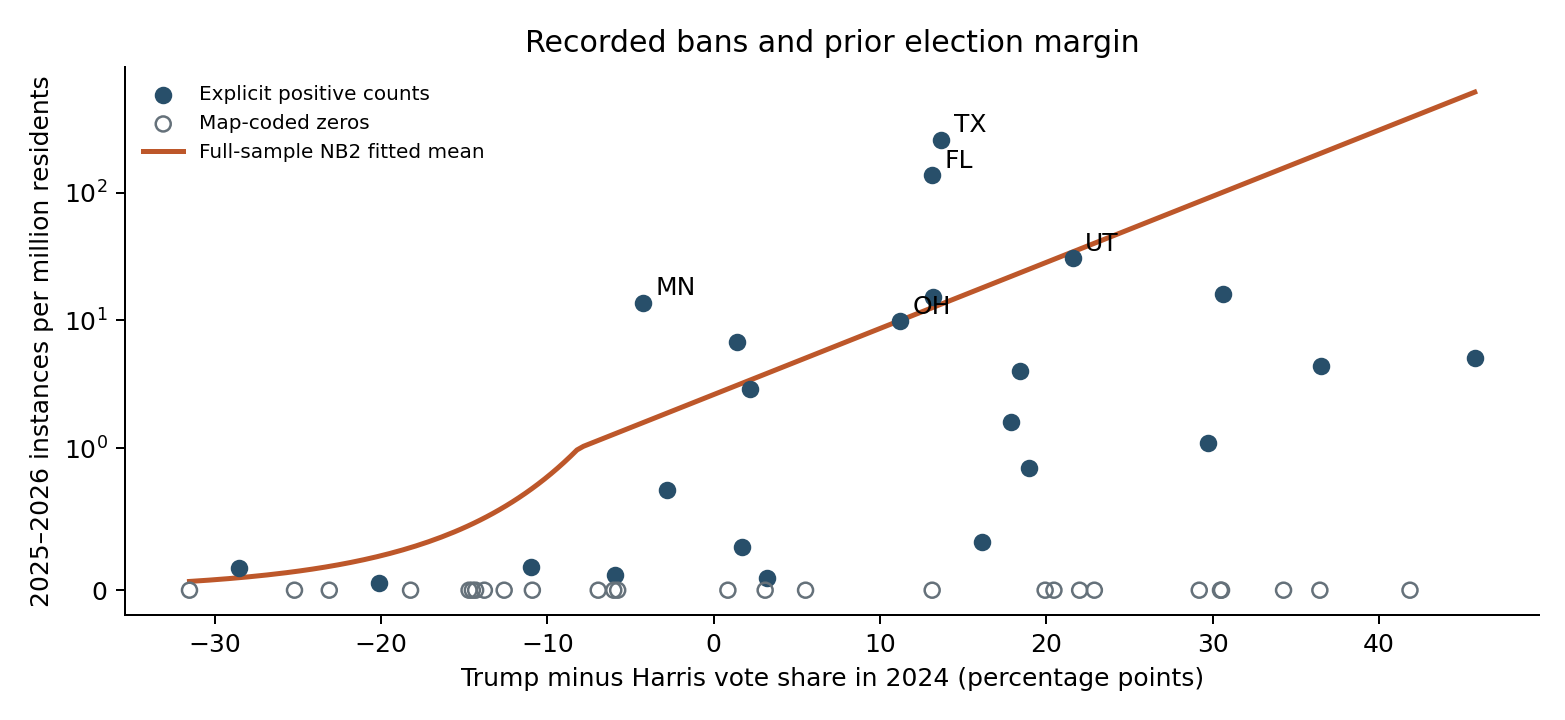
High-rate states mostly voted Republican.
The 2024 election came before the 2025–26 school year, so it can describe states before the outcome was recorded. Voting is not party identification or control of state government, and none of this describes individual challengers.
voted Republican in 2024 (Minnesota did not)
top ten, against +3.8 for the other 40 (points)
Pearson / Spearman, margin vs rate
states with no count also voted Republican
Two separate findings. The ranking pattern is clear at the top, but across all fifty states the rate correlations are weak, and they remain weak after excluding Texas and Florida (Pearson 0.223, Spearman 0.234). Averages are unweighted state averages.
05 / MODEL AND VALIDATION
A count model fits the middle and fails at the top.
Poisson and negative binomial models were fitted with population as an exposure offset and the 2024 Republican margin as the single predictor. Each model was tested by leaving one state out at a time.
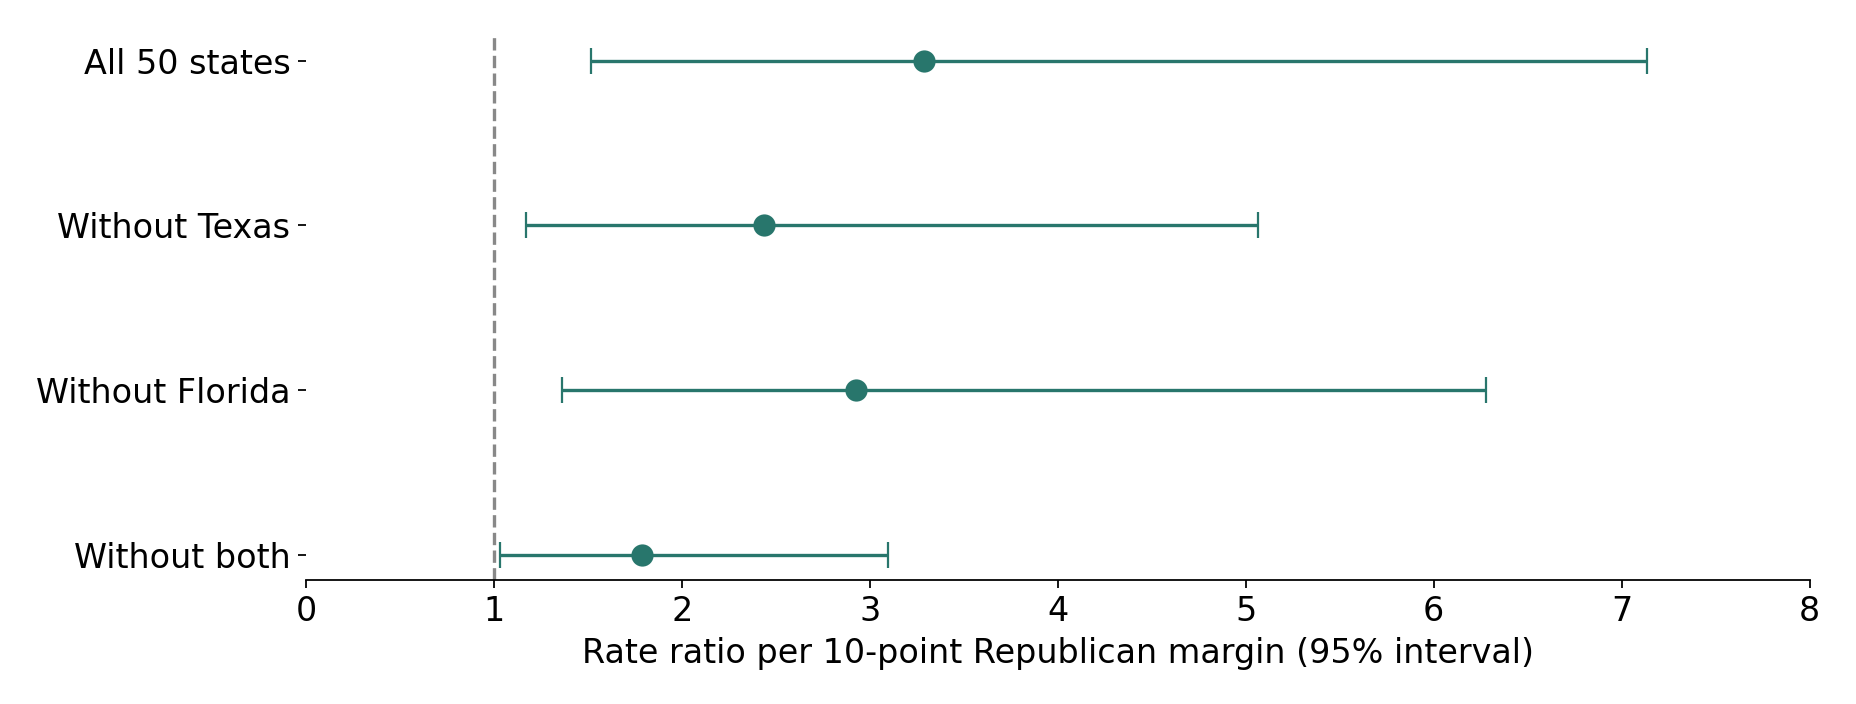
Rate ratio 3.29 per 10-point margin
In the negative binomial model, a 10-point shift toward the Republican margin is associated with about 3.3 times the recorded rate (95% interval 1.52 to 7.13).
The estimate is sensitive to Texas and Florida: without both it falls to 1.79 (1.03 to 3.10). Intervals do not include uncertainty from reporting coverage.
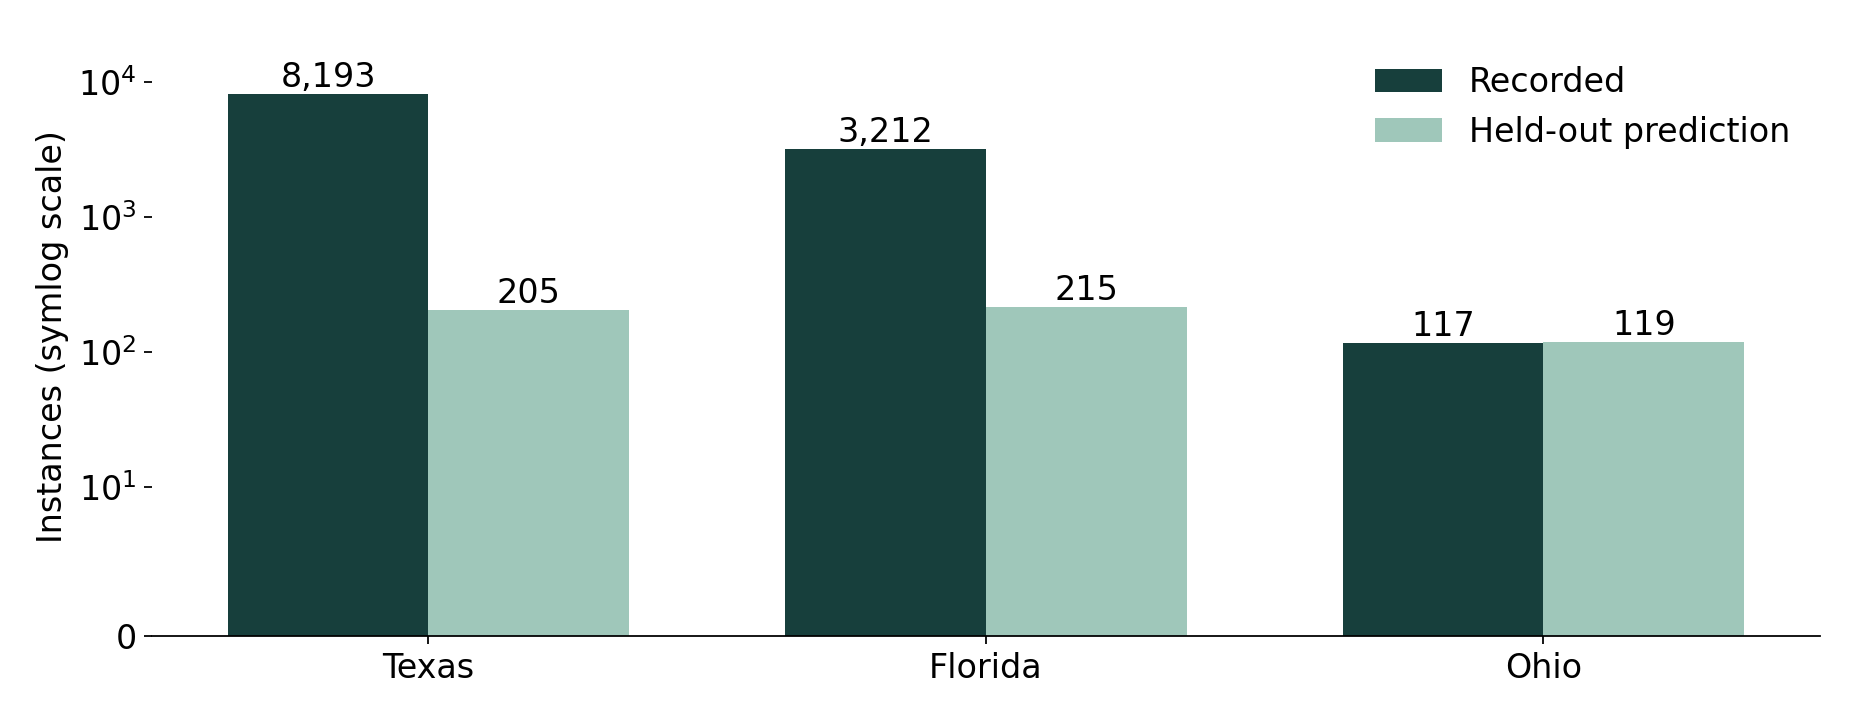
Held-out states
Adding the margin improves the held-out log score slightly (2.934 to 2.889) but worsens mean absolute error (274 to 343 instances).
Left out of the fit, Texas is predicted at 205 against 8,193 recorded, and Florida at 215 against 3,212. These are predictions for excluded states within one year, not forecasts of a future year.
06 / LIMITS AND NEXT STEPS
What this analysis can and cannot tell us.
What the evidence shows
Recorded bans in 2025–26 are concentrated: two states hold 95.2%. The highest-rate states mostly voted Republican in 2024. The fitted model’s election-margin estimate is sensitive to Texas and Florida, and the rate correlations remain weak after excluding both. Count models fail on the largest totals; this is not a forecast.
What it does not show
Actual bans in grey states; unique books or districts by state; who challenged a book or why; how districts reviewed challenged books. A within-year validation does not test a future year.
Research question 3 needs district records. RQ3 asks what happened when a district reviewed a challenged book with input from librarians and local residents. State totals cannot answer it. Records requests for review cases were sent to ten districts on November 2, 2026; they cover cases from the 2022–23 index used to select this study’s cases, a different period from this page. Results will be published once the coding has been reconciled with the supplied records.
Sources: PEN America 2025–26 state map ↗ (saved October 31, 2026) · Census July 2025 population ↗ · FEC 2024 presidential results ↗.
07 / FILES & REPRODUCIBILITY
Take the 2025–26 evidence with you.
The presentation, its saved results
and the code that produced them.
PPTX / PRESENTATION · 1.5 MB
2025–26 presentation ↓
The 2025–26 analysis with speaker notes. Appendix A: model code. Appendix B: RQ3 records-request progress (2022–23 cases). Appendix C: verification of the earlier report.
PDF / SLIDES · 0.9 MBPresentation as PDF ↓
The same slides for printing or viewing without PowerPoint.
ZIP / PYTHON + CSV · 0.6 MB2025–26 code, sources & results ↓
Saved PEN, Census and FEC sources with checksums, the analysis script and tests, every saved result table, and the script that draws the labelled map.
CSV / 50 STATESState table ↓
Instances, population, rate per million, 2024 vote counts and margin, and PEN map status for every state.